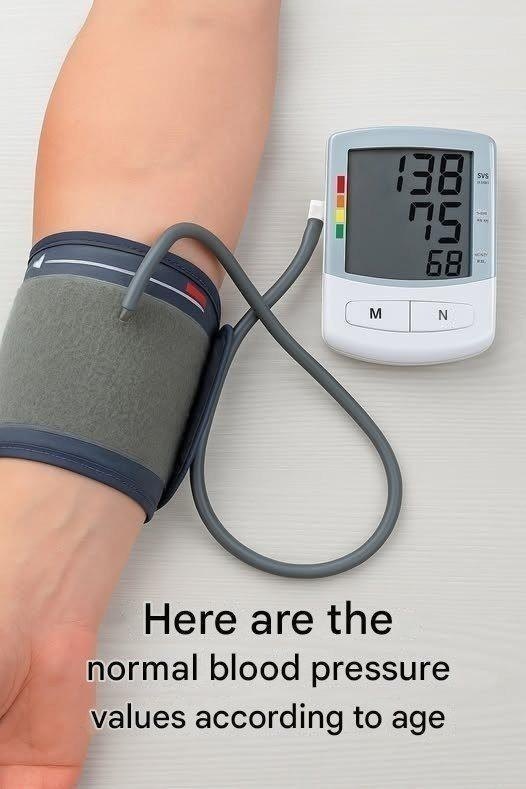
Charts that claim “normal blood pressure by age” can be a bit misleading. In reality, doctors don’t define completely different normal values for each age group—they use general ranges for adults, then interpret them in context.
🩺 Standard blood pressure categories (adults)
- Normal: below 120 / 80 mmHg
- Elevated: 120–129 / below 80
- High (Hypertension Stage 1): 130–139 / 80–89
- High (Stage 2): 140 / 90 or higher
These guidelines are widely used by organizations like the American Heart Association.
📊 How age actually affects it
- As you get older, arteries become stiffer, so blood pressure tends to rise naturally
- However, that doesn’t mean higher numbers are “ideal”—it just means they’re more common
Doctors may allow slightly higher targets in older adults depending on overall health, frailty, and medications.
👴 Typical observed ranges (not “ideal targets”)
| Age group | Common range seen |
|---|---|
| 18–39 | ~110–120 / 70–80 |
| 40–59 | ~115–130 / 75–85 |
| 60+ | ~120–140 / 70–90 |
👉 These are not goals, just averages people often fall into.
⚠️ Important points
- A reading like 140/90 is still considered high, even if you’re older
- Very low blood pressure (e.g., under 90/60) can also be a problem if it causes dizziness
- One reading isn’t enough—patterns over time matter
✅ Bottom line
- “Normal blood pressure by age” charts online are oversimplified
- The general target for most adults is still around or below 120/80 mmHg
- Personal targets should be set with a doctor, especially if you’re older or have other conditions
If you want, tell me your age and a recent reading—I can help you interpret it more precisely.
